
Improve WordPress SEO of Your Directory Site Easily
A list of recommendations on how to do SEO for your WordPress website.
The essential website metrics you should track on your WordPress website.

When running a website, it’s crucial to know your website analytics to make data-driven decisions. However, there are so many metrics out there that sometimes it becomes really overwhelming to analyze all of them.
In this article, we’ll show you the essential site metrics that every website owner should track. Please note that you have to integrate Google Analytics with your website to get all the necessary data and metrics that we’ll discuss in this article.
Additionally, we recommend checking out our article about the most popular mistakes people make when they create and run websites.
So, without wasting time, let’s get started!
First of all, let’s take a look at the essential site metrics that you should track on your directory or marketplace website.
The first metric you should keep your eyes on is website traffic. Tracking the overall traffic on your website is essential for understanding its performance, as it gives you an insight into how many visitors your site attracts. This metric has two main aspects:
By monitoring website traffic, you can identify which of your marketing strategies are bringing in new users and determine which channels drive the most traffic (e.g., paid ads or reviews on third-party platforms).
Another important website metric is the bounce rate, which measures the percentage of visitors who leave your site after viewing only one page.
This metric can help you identify potential issues with your website’s user experience, content, or design. A high bounce rate could indicate that your site is difficult to navigate, lacks engaging content, or has technical issues.
But what is an average or a “normal” bounce rate? Let’s take a look at the stats:
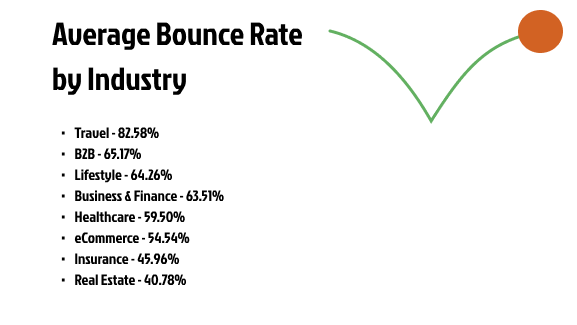
If you are running a niche directory website or a marketplace of services, the average bounce rate for your website will be somewhere between 50 and 70%.
If you see that some particular pages have a higher bounce rate than average (depending on your industry), you should try reducing it by analyzing the possible technical issues, changing the page’s content, playing around with UI and so on.
One more cool metric that you should definitely track is the number of pages viewed per session, as it reveals how engaged visitors are with your website’s content. If you have many viewed pages per session, it shows Google that your website visitors find your site valuable and are more likely to stay and explore further.
By analyzing this metric, you can find out which pages or content pieces keep users engaged, allowing you to adjust your content strategy and understand what works and what doesn’t.
Lastly, it’s essential to monitor the average session duration on your website. This metric tells you how long, on average, users spend on your site during a single visit. The longer session durations typically correlate with more engaged visitors who consider your content valuable.
Here everything is simple. The longer session – the better. Usually, it works great with blog articles that require at least a few minutes to read, and if you manage to refer users to some product page or another article after that – you are a rockstar, and Google will like it.
Now, let’s take a look at some other site metrics that can tell us a little bit about user behavior on your directory or marketplace website.
Understanding user behavior is crucial to optimizing your directory website or marketplace and improving user experience and conversions. One key aspect is determining the top pages on your website.
Knowing which pages are most popular among your website visitors is essential, as this shows the content that resonates well with your audience. Moreover, it’s important for your SEO (search engine optimization) since you can add internal links from top pages to other pages on your website that you want to rank higher.
Usually, when you have a brand-new website, the top pages will be:
However, as your website grows, more pages will generate a lot of traffic (hopefully). For example, if you are running a blog (in a proper way), sooner or later, you’ll see that particular articles bring more traffic than others. For you, it means – creating more content on that topic.
By analyzing the top pages, you can improve your content strategy and make content your audience likes.
Another important metric to track is your website’s entry and exit pages.
By examining entry pages, you can understand where your visitors are coming from and what content drives them to your website. Similarly, analyzing exit pages can help you understand potential issues with content that may not be useful or interesting for your visitors.
It’s vital to track the proportion of mobile and desktop visitors to your website for several reasons:
So, it’s crucial to understand what devices your customers usually use to prevent any potential tech issues and not waste your marketing budget.
Now let’s talk about the site metrics, which show us where our users are coming from to our website. Are they coming from YouTube, Facebook, Google, or probably another website?
Let’s dive in!
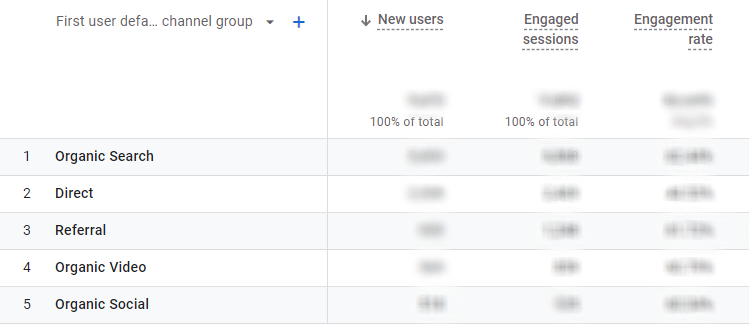
We’ll start with organic search traffic since it’s usually the most important one. Organic traffic refers to the number of users visiting your site from search engines (Google, Bing, Yahoo, etc.), which doesn’t include paid ads.
This is the most “wanted” traffic since it’s free. You don’t have to pay for ads or for placements on other websites to get new customers. Moreover, by tracking this metric, you can assess the effectiveness of your SEO efforts.
Besides assessing the organic traffic in total, it’s important to pay attention to:
As you can understand from the title, social media traffic refers to visitors coming to your website via links shared on various social platforms like YouTube or Facebook.
By monitoring this metric, you can measure your SMM efforts and decide whether it is worth the investment. Here are a few key aspects to track:
Referral traffic refers to users that visit your website through hyperlinks on other websites (this traffic doesn’t include organic and social media ones). By tracking this metric, you can understand the success of your backlink-building activities and find out which partnerships work better than others.
Here, like with social media traffic, it’s crucial to check the particular websites where traffic comes from. It gives you a better idea of websites that have a “warm” audience for your business, so you can search for more similar websites and collaborate.
Here, we’ll briefly discuss why it’s important to know the age, location and language of your website visitors.
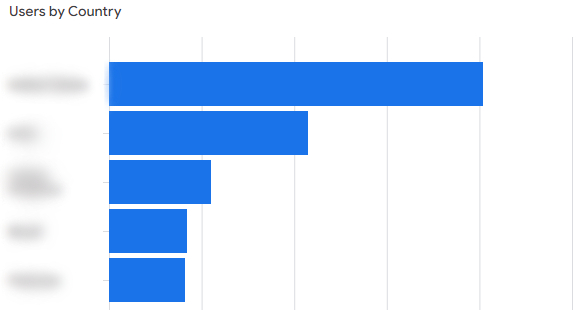
Understanding the age of your audience is not essential for all websites since there are some niches that cater to people of all ages. However, by analyzing user location, you can identify the regions that generate the most traffic, allowing you to adjust your marketing efforts. For example:
Imagine that you are running a restaurant directory website in the US and want to start Google Ads to promote it. If you are tight on budget and cannot run ads for the whole US, you should spend your budget as effectively as possible, and you have two options:
Knowing the age of your audience is important when you have a business in a specific niche where age matters, like an influencer marketing platform or some kind of event directory website. In these niches, you have to know the age of your users to adjust your content strategy and overall marketing, so you can target different age groups.
Language is another critical factor in developing and maintaining a successful website. Imagine that you are running a niche micro-jobs platform that operates in Europe. By analyzing the primary languages your website visitors speak, you can optimize your content for the most commonly used languages (e.g., English, German and French).
It may help you to deliver content that is accessible and easy to understand for your target audience.
Finally, let’s discuss the crucial metrics for e-commerce websites selling goods or services online. In this section, we’ll discuss three vital site metrics: Conversion Rate, Customer Acquisition Cost, and Lifetime Value.
The conversion rate is an indicator that shows how well you’re turning website visitors into customers. It’s essential to continuously analyze your conversion rate because it helps you identify areas for improvement and potential bottlenecks in your sales process.
In order to track conversions and conversion rates, you have to create and set up goals in your Google Analytics. But if you haven’t done it yet, you can calculate the conversion rate on your website manually. Simply divide the number of completed transactions by the total number of website visitors and multiply it by 100.
For example, if your website had 5,000 visitors last month and 100 of them made a purchase, your conversion rate would be:
(100 / 5000) * 100 = 2%
A good conversion rate depends on various factors like our industry, product offerings, and target audience. Currently, across industries, the average landing page conversion rate is 2.35%.
In any case, your conversion rate should always be a priority, as it directly affects your revenue.
The next metric is customer acquisition cost. Simply saying, this metric shows you how much you have to spend on marketing to get a new customer. To calculate it, you can simply divide the total marketing and sales expenses for a specific period by the number of new customers acquired during that time.
For example, if your business spent $5,000 on marketing last month and acquired 50 new customers:
$5,000 / 50 = $100
In the case at hand, you understand that it costs you $100 to get a new customer, and now you can adjust your marketing budget and set a reasonable price for your services.
The last one is a lifetime value (LTV). It shows the total amount of revenue a unique customer generates for your business while using your products or services. It’s a bit vague metric, and you should have enough data to calculate it (i.e., run your business for at least 1 year).
But calculating it may be helpful since you can set realistic expectations for your marketing efforts.
To calculate LTV, you can multiply the average purchase value by the average number of purchases a customer makes and the average customer lifespan. For example, if your customers, on average, make two purchases per year, spending $50 per purchase, and stay loyal for three years, the formal will be the following:
$50 * 2 * 3 = $300
In this case, your average LTV would be $300. It gives you a rough estimate of how much you can earn from one customer and how much you are ready to spend on their acquisition to stay profitable.
That wraps up our article on the essential site metrics for your directory or marketplace websites. We hope this article was helpful to you and now you better understand what “numbers” you should track.
If you haven’t built your website yet, you can check out our guide on how to create a rental marketplace like Airbnb.
A list of recommendations on how to do SEO for your WordPress website.

A few tips on how to choose a WordPress theme for your directory website.

A few tips on how to secure your WordPress directory website.